Chapter 11
Asset Allocation
Asset allocation is the division of your capital across asset classes — stocks, bonds, cash, real estate, and the human capital that funds them all. It is the one investment decision that shapes everything downstream, and this chapter is about making it deliberately.
A study by Brinson, Hood, and Beebower (1986)66,40 found that approximately 93.6% of the variance in a pension fund’s returns was attributable to its investment policy — its strategic asset allocation. Adding market timing raised the explained variance by only 1.7 points and security selection by 4.2. A Vanguard study of balanced funds in the US, Canada, and the UK from 1990 to 2015 reached a similar figure of roughly 90%.
Be precise about what that number measures, because the popular version of it is wrong. These studies decompose the variability of a single fund’s returns over time — and that quantity is dominated by the simple fact that markets move together, so a high figure is close to inevitable for any diversified portfolio. It is routinely restated as “asset allocation determines 90% of your returns,” which is a different and false claim.
Ibbotson and Kaplan settled this by asking all three questions separately.67 Asset allocation policy explains:
- About 90% of the variability of one fund’s returns over time
-
The Brinson result. It tells you that your portfolio bounces around because markets do, which is true and not very useful.
- About 40% of the variation of returns among funds
-
This is the number that answers the question you actually care about — how much of the difference between your results and someone else’s comes from allocation versus fund selection, timing, and fees. It is substantial, and it is less than half.
- About 100% of the level of return, on average
-
Across funds, active management is roughly a wash before costs and a loss after them. The average fund earns its policy return minus its fees.
The enduring takeaway remains that asset allocation is the decision worth most of your attention — 40% of cross-sectional variation dwarfs anything else you control, and the third finding says the remaining effort is on average value-destroying. Claim the realistic 40%, not the overstated 90%. Anyone selling you a product on the strength of the 90% figure either has not read the papers or is counting on you not having read them.
The primary goal of asset allocation is not merely to maximize returns but to minimize risk necessary to achieve desired returns. No investment is riskless if the time horizon is long enough.
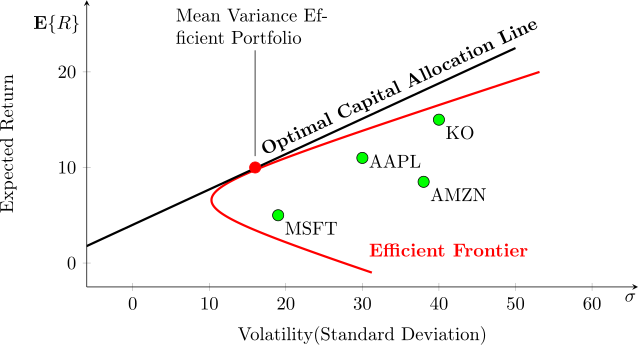
The core of modern asset allocation rests on the efficient frontier (see Figure 11.1), derived from Modern Portfolio Theory (MPT). The frontier identifies the set of portfolios that deliver the highest expected return for a given level of volatility, or equivalently, the lowest volatility for a target return. Combining these risky holdings with a risk-free asset produces the Capital Allocation Line (CAL), which establishes your actual risk-return tradeoffs.
Need, Ability, and Willingness to Take Risk
Maximal vs. Optimal Portfolio Returns
Diversified Portfolio
Diversification Across Asset Classes
Asymmetry In Asset Correlation
Negative Correlation Between U.S. Treasury Bonds And Stocks
Diversification Across Sectors And Industries
Diversification Against Political Risks
Time Diversification
Diversification Summary
Tax Diversification
Tax Efficiency of Assets
Assigning Assets into Tax Buckets
Tax-Advantaged Accounts: Choosing Between Pre-Tax and Post-Tax Options
Taxable Accounts
Human Capital as an Asset
Human Capital and Its Relationship with Asset Classes
Human Capital and Asset Allocation Across the Life Cycle
Human Capital Models
Calculating Human Capital
Mortality Risk and Bequest Motives
Your House as an Asset
Basic Factors of Home Equity Value
Implications for Asset Allocation
Real estate market vs. Stocks and Bonds
Allocation by Age and Work Experience
Asset Allocation Models
Modern Portfolio Theory
MPT Under Deep Uncertainty
Portfolio Construction with Asymmetric Correlations
Post-modern Portfolio Theory (PMPT)
Black Litterman (BL) model
Stochastic Portfolio Theory (SPT)
Risk Parity
Lazy Portfolios
Target Date Funds (TDFs)
Age-based Bond / Stock Ratio
Flight Path Model
Financial Samurai’s Allocation of Stocks and Bonds
The “All Weather” and “All Seasons” Portfolios
The “Optimal Portfolio” by Nick Maggiulli
Lazy Stocks-only Portfolio
Boglehead’s Lazy Portfolios
Lazy Portfolio for 401k
Lazy Portfolio for HSA
Tax-Efficient Retirement-Bucket Portfolios
Capital Deployment: Lump-Sum vs. Dollar-Cost Averaging
Dollar-Cost Averaging
Lump-Sum Investing
Rebalancing
Why Rebalancing Works
Rebalancing Methods
Tactical Overlays and the Limits of Timing
The line beats the curve, which tells you how to set your risk. The geometry of the CAL carries a direct rule that textbook descriptions often bury. Draw a line from the risk-free rate and rotate it upward until it touches the frontier tangentially. That single point of contact is the optimal mix of risky assets, and every combination of that portfolio with cash — or with leverage, past the tangency point — lies along that straight line. Because a tangent line to a concave curve sits strictly above the curve everywhere else, every other point on the efficient frontier is mathematically dominated: for any given volatility, the line delivers a higher return.
This cleanly separates portfolio construction into two distinct steps. First, pick the risky portfolio: it is always the tangency portfolio, regardless of your personal risk tolerance. Second, choose your total risk level: you dial this in by adjusting how much cash or short-term paper you hold alongside the risky sleeve, never by reshuffling the assets within it. Sliding down the curve into a more defensive basket of risky assets is the inferior way to reduce risk — yet that is precisely what fund managers sell as a “conservative” allocation. Holding the tangency portfolio at sixty cents on the dollar with forty cents in Treasury bills consistently beats putting the whole dollar into a low-volatility frontier fund.
Two real-world frictions keep this from being an ironclad law. The tangency point relies entirely on estimated returns, volatilities, and correlations, all of which are noisy enough in practice that the frontier is better treated as a rough sketch than an exact formula (section “MPT Under Deep Uncertainty”). The model also assumes you can borrow at the risk-free rate. You cannot: your borrowing rate exceeds what you earn on cash (section “Brokerage Firms and Rates”), which kinks the line downward past the tangency point and erodes the advantage of leveraged portfolios. But on the unleveraged, cash-diluted side — where nearly every private investor operates — the logic holds firm.