Implications for Asset Allocation
The optimal mortgage amount hinges on a delicate balance of your financial assets, wealth, human capital, and risk tolerance. When determining how much of your investment portfolio to allocate to your home, consider your long-term financial goals to balance risk and return, and assess your overall risk tolerance. Real estate investments, such as your home, offer stability and potential appreciation but are also illiquid and typically involve leverage. Households often accumulate financial wealth for a down payment, leading to a significant shift in asset allocation in the year of purchase.
- Liquidity and Market Efficiency
-
Real estate is inherently less liquid than equities, meaning it can take longer to sell and convert into cash. This lack of liquidity is compounded by market inefficiencies and idiosyncratic risk, which refers to the unique risks associated with individual properties or local real estate markets. These risks include factors like location desirability, property condition, and local economic conditions, all of which can affect a property’s value88 and salability. Most households cannot diversify away from risks specific to their home’s capital gains, unlike institutional investors who can partially diversify such risks in private equity and commercial real estate. This idiosyncratic risk not only reduces the Sharpe ratio of housing investments but also makes these ratios dependent on the holding period. Longer holding periods generally offer a more favorable risk-return trade-off due to the term structure of idiosyncratic risk.
In different geographic areas, the impact of idiosyncratic risk varies. Wealthier areas typically exhibit low price index volatility but high idiosyncratic risk. Without considering this idiosyncratic component, one might mistakenly believe that high-income zip codes provide exceptionally high Sharpe ratios for local homeowners. However, when idiosyncratic risk is accounted for, the apparent differences in Sharpe ratios between affluent and less affluent areas diminish.
The idiosyncratic component of capital gains, which accounts for factors such as capital investment, local market fluctuations, and house characteristics, is a primary driver of capital gains variance across most of California’s zip codes for holding periods up to 10 years. Even after 15 years, it represents between 25% and 60% of the variance, depending on the location. The influence of this component is expected to decrease over time with advancements in property technology platforms like Zillow, which improve market liquidity and facilitate transactions.
- Mortgage Considerations
-
The mortgage is a liability against the home, and the cheapest leverage most households will ever be offered. Account for it as a negative bond (section “The Mortgage as a Negative Bond”): a bond pays its holder a fixed stream, a mortgage makes you pay one, and the two cancel on your balance sheet. Two bookkeeping rules follow. A principal prepayment is a bond purchase — it retires debt at a guaranteed after-tax return equal to the note rate — so it belongs on the fixed-income side of your allocation, not the equity side, even though it shows up as “home equity.” And the down payment plus accumulated home equity is your real-estate sleeve, sized net of selling costs. Netting the mortgage against the bond sleeve is right only when the after-tax mortgage rate exceeds the after-tax bond yield (section “Prepay or Invest? Compare the Right Two Things”); when it does not, the bonds stay. The one genuine diversification effect is that housing returns correlate weakly with equity returns, which argues for a higher equity share in the liquid portfolio after a purchase, not a lower one.
- Home Equity and Debt Repayment
-
The equity in your home is considered an asset that contributes to your net worth. It increases as you pay down the mortgage or as the property value appreciates. However, it is important to account for selling costs when calculating your net worth. Furthermore, be aware that equity can decrease and potentially go “underwater” during market downturns. This equity can be borrowed against, typically at favorable rates, providing a source of funds when needed. However, there is a trade-off between accelerating mortgage repayment and investing in low-risk fixed income assets, like government bonds from high credit-rating countries. The decision here often hinges on the comparative expected return of the investments versus the interest saved by paying down the mortgage.
Purchasing a home involves opportunity costs, as the down payment and additional expenses — such as larger mortgage payments, homeowner’s insurance, and maintenance costs — could be invested elsewhere, typically in stocks or bonds. These expenses can significantly reduce your ability to save and invest, potentially impacting the growth of your overall investments. The decision should align with your broader financial objectives, such as retirement planning, wealth accumulation, or debt reduction.
Analyzing Mortgage Rates: Borrowing Costs vs. Stock Market Returns
The mortgage rate sets the price of the leverage, and the comparison that matters is not against the stock market. Through 2021 a 3% mortgage sat well below the forward planning return on a balanced portfolio (roughly 7% nominal, section “Savings Rate For Retirement”), and carrying the loan while investing looked free. At the 6%-plus rates of 2026 the after-tax cost of the note exceeds every risk-free alternative and sits within a point or two of the expected return on equities, so the loan is no longer cheap leverage but a bond you are short at a high coupon. The right test is the one in section “Prepay or Invest? Compare the Right Two Things”: prepayment competes with bonds of matched duration, not with stocks, because its return is certain and theirs is not.
Renting and investing the down payment and the ownership costs you avoid buys liquidity and diversification, at the price of the forced saving a mortgage imposes and the leveraged appreciation a rising market delivers. Which side wins depends on the unrecoverable costs of each, and section “Rent vs Buy decision” runs that comparison; the mortgage rate is one input to it, not the answer.
Housing’s Role in Optimal Portfolios
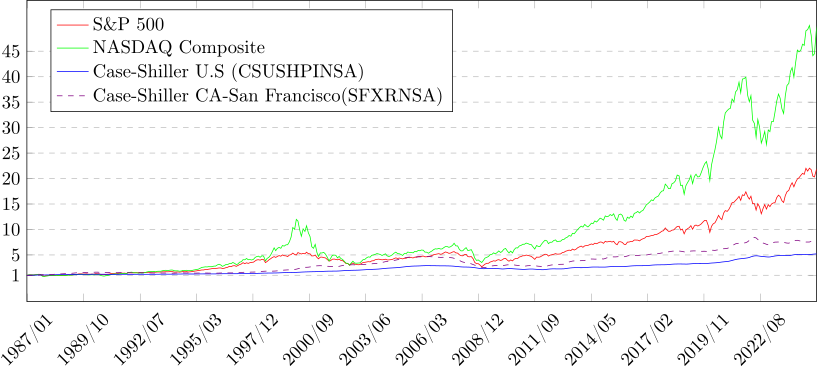
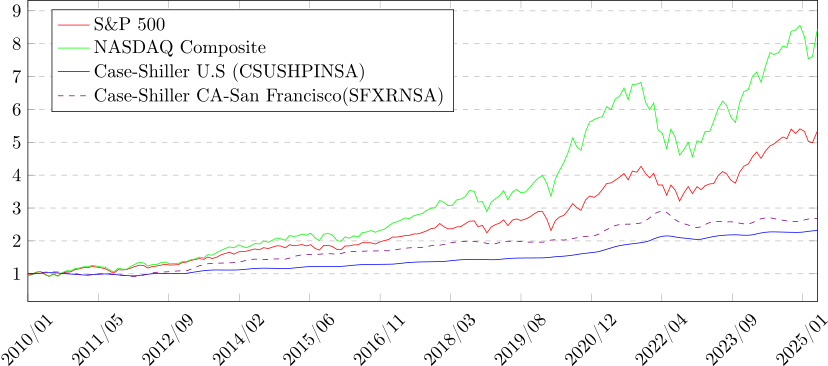
The Case-Shiller House Price Index tracks U.S. residential prices across 20 metropolitan regions using a repeat-sales method — comparing successive sales of the same properties — which makes it a clean benchmark for measuring housing against stocks and bonds (see Figure 11.4 and Figure 11.5).
Using realized Case-Shiller returns instead of appraisal-based estimates, Wu and Pandey (2012)89 computed the optimal portfolio weight of residential real estate across 20 metropolitan areas over 1987–2010. Their result is the one most homeowners would rather not hear: for residents of most cities, the optimal portfolio is weighted heavily toward equities, then bonds, with residential real estate carrying only a small weight. The exceptions — Washington DC, Los Angeles, Portland, San Diego, and San Francisco, where housing optimally runs 60–90% of the weights — are precisely the high-appreciation coastal metros, and even there the finding leans on a historical run that need not repeat.
Here is the uncomfortable gap. Theory says housing should be a minor slice of an optimal portfolio; in practice, the typical household holds the majority of its net worth in a single home. That gap is the central portfolio problem with a primary residence, and it has three compounding causes:
- Concentration
-
One property, one street, one city — a single, undiversified asset, often the largest you will ever own. Its idiosyncratic risk, discussed above, cannot be diversified away the way a stock position can.
- Illiquidity
-
You cannot sell 5% of the house when it drifts above its target weight. The position cannot be rebalanced, so every other holding must do the rebalancing work.
- Double exposure
-
A home’s value and the owner’s paycheck often ride on the same local economy, so a regional downturn can strike job and home equity together — the concentration risk examined in the buy-versus-rent discussion (section “Rent vs Buy decision”).
None of this argues against owning a home. It argues for accounting for the home accurately inside your allocation instead of leaving it off the books:
- Count home equity — valued net of selling costs, not an unvetted online estimate — as your real-estate sleeve.
- Treat the mortgage as a negative bond and net it against your fixed-income allocation, as described above: carrying a bond holding that yields less after tax than the mortgage costs is an expensive way to feel diversified, and prepayment closes the spread (section “Prepay or Invest? Compare the Right Two Things”). Keep the bonds that yield more, and the ones you hold for liquidity.
- Because the house itself cannot be rebalanced, let the liquid portfolio carry the diversification — and, where possible, tilt it away from your local economy and your employer’s industry, so that house and human capital are not the same bet.
Used this way, residential real estate also offers a modest hedge against inflation across most historical periods — a genuine but secondary benefit, not a justification to overweight the asset.