Diversification Across Asset Classes
The goal is to construct a diversified portfolio with a mix of asset classes that have varying degrees of correlation to one another. Holding non-correlated assets dampens portfolio volatility and preserves capital.
This involves dividing your investable assets among various asset classes, such as:
- Stocks/Equities
-
generate long-term capital appreciation and dividend income, but carry significant price volatility.
- Bonds/Fixed Income
-
deliver contractual income and portfolio stabilization at lower expected returns than equities. Beyond traditional nominal bonds, consider other fixed income securities like treasury inflation-protected securities (TIPS), municipal bonds, and corporate bonds. TIPS adjust principal directly with inflation, guaranteeing a real yield. Municipal bonds provide tax exemption at the federal and state levels.
- Cash/Cash Equivalents
-
preserve nominal principal and provide immediate liquidity, suitable for short-term needs and emergency reserves. Holding liquid instruments like money market funds (MMFs) and certificates of deposit (CDs) buffers the portfolio during severe market drawdowns.
- Real Estate
-
Real estate investments deliver steady rental cash flow and equity appreciation. Real Estate Investment Trusts (REITs) provide this exposure in liquid form without physical property management. According to National Association of Real Estate Investment Trusts (NAREIT), REITs have historically provided competitive returns and diversification benefits.
- Commodities
-
Investing in commodities like gold, silver, oil, and agricultural products can hedge against inflation and supply disruptions. Commodities often exhibit low correlation with financial assets, dampening overall portfolio volatility.
- Alternative investments
-
These include private equity, hedge funds, and venture capital. These investments offer high return potential but impose severe illiquidity and opaque fee structures. They suit qualified purchasers who can lock up capital for decade-long horizons.
- Cryptocurrency
-
such as Bitcoin and Ethereum trades on decentralized blockchains with volatility several multiples that of equities. Do not lean on it as a diversifier: under systemic stress and algorithmic de-risking, crypto correlations with high-beta tech converge toward — exactly when you would want the hedge, you do not have one. Treat it as an unhedged, liquidity-sensitive speculative position, sized small enough that a 70% drawdown is survivable; do not treat it as a substitute for bonds or gold.
Within each of those broad categories, there are additional asset subclasses and geographic regions to consider as well for further diversification. Diversify systematically: allocate capital within asset classes (preferring index funds to individual stocks or bonds), and across asset classes (preferring a mix of stocks, bonds, and REITs), because you cannot predict which assets will outperform in any given cycle. You cannot control the market. A core set of funds from which to build a portfolio includes:
- Total US stock market index fund
- Total international (ex-US) stock market index fund
- Total US bond market fund
- Total international (ex-US) bond market fund
- REIT index fund
| Class | Varieties | Returns |
| Stocks | domestic/foreign | Historically have returned about 6-10% annually depending on market sector |
| developed/emerging | ||
| value/growth | ||
| large/mid/small/micro | ||
| Bonds | government/corporate | Historically have returned about 4–7% depending on category |
| investment-grade/junk | ||
| short/intermediate/long | ||
| domestic/foreign | ||
| Real Estate | raw/residential/commercial | Historically have returned about 8% for REITs |
| domestic/foreign | ||
| real property/REIT | ||
| Cash | checking/savings/money market | Historically have returned about the rate of inflation, on average |
| Commodities | precious metals/agriculture/energy | Historically have returned about the rate of inflation, on average (with wild swings in the interim based on demand) |
A single optimal asset allocation does not exist for all investors. The appropriate mix depends on your specific financial situation, investment time horizon, cash flow needs, and psychological ability to withstand potential losses during market downturns. Evaluating your risk tolerance requires analyzing your psychological capacity to endure drawdowns alongside your financial capacity to absorb capital losses. Some individuals accept high volatility for the potential of higher returns, while others prioritize capital preservation.
The most influential factor in determining the behavior of your portfolio is the allocation between stocks and bonds. A higher percentage of bonds in your portfolio will result in lower volatility, but this also means lower returns. However, if you have already achieved your desired level of capital accumulation, lower volatility may be preferable as you will be taking distributions from your portfolio.
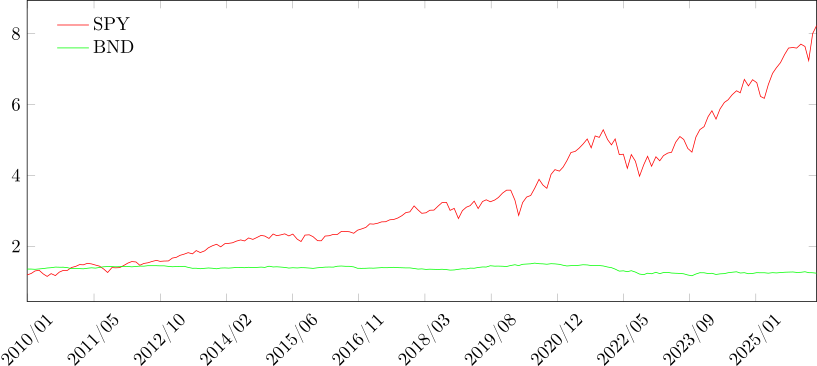
You choose the target percentages for each asset, per your wealth accumulation goals and personal preferences. The conventional ladder — 90/10 stock/bond with decades to retirement, 80/20 or 70/30 mid-career, 60/40 as retirement approaches — reflects round-number convention, not mathematically measured optima, and the data cannot rank neighboring rungs: across the historical record, portfolios anywhere in the roughly 35–80% equity band supported the same sustainable withdrawal rate.44 Pick the rung whose drawdowns you can hold through, and spend your precision elsewhere.
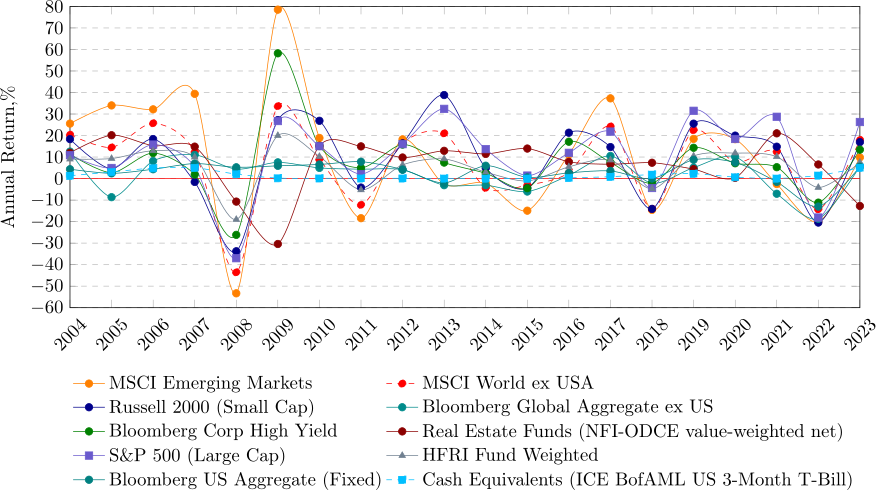
Callan’s Periodic Table of Investment Returns shows the behavior of different asset classes across years. Drawn as a chart it is shown in Figure 11.3.