Which Number to Plan With
Inflation has not always been this calm — it peaked above 14% in 1980 (Figure 2.1), and the long-run CPI-U average since the series began in 1913 runs right around 3.2% annually.
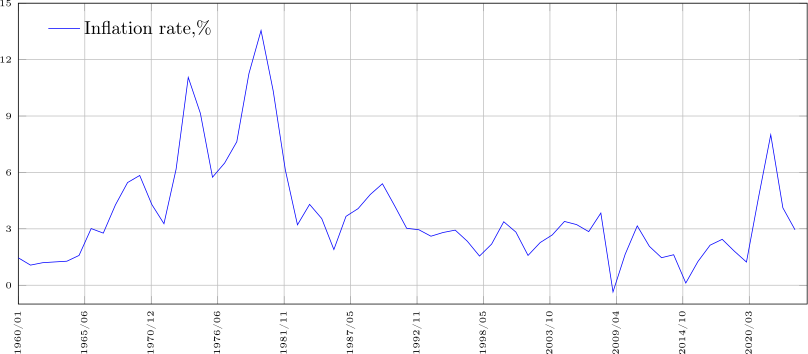
That century figure is quoted everywhere, including in earlier editions of this book, and it is the wrong number to plan with. It is a geometric mean taken across three monetary regimes, two of which no longer exist: a gold-convertible dollar, then Bretton Woods, then a fiat dollar with no inflation target at all until the 1990s. It is also dominated by a single episode. Roughly a fifth of the entire century’s price growth occurred in the ten years from 1970 to 1980 — nine percent of the elapsed time. Remove 1970–1983 and the remaining ninety-nine years compound at 2.6%.
Every window drawn from the current regime lands lower and lands close together:
Two forward-looking anchors agree with the bottom of that range. The Federal Reserve targets 2% on the PCE index, and CPI-U runs structurally about 0.4 points above PCE because of formula, weighting, and scope differences — so a central bank hitting its target implies roughly 2.4% CPI-U. The bond market’s breakeven rate, the spread between regular Treasuries (whose payments are fixed dollar amounts) and TIPS of matched maturity (whose principal adjusts with inflation), has sat near the same level; because TIPS principal is indexed to CPI-U itself, that spread is directly comparable with no adjustment. Three independent methods — realized experience under the current regime, the policy target, and the traded price of inflation — converge on the same neighborhood. That convergence, not any one of them alone, is the justification.
This book uses two deflators, not one. A single rate applied everywhere is wrong in both directions at once, because the cost of the error flips sign depending on what you are deflating.
- 2.5% –- for real returns, discount rates, and hurdles.
-
Use this whenever you are asking whether an investment beat inflation, computing a real rate of return, or discounting a future cash flow. (Real returns and discounting are defined later in this chapter, in section “Compound Interest” and section “Present vs. Future Value” — return here when you need to pick a rate. A “hurdle” is the minimum return an investment must clear to be worth doing.) Overstating inflation here manufactures a hurdle that does not exist and pushes you into more risk than you need to carry.
- 3.5% –- for spending and retirement-need projections.
-
Use this when you are sizing a future liability: the retirement number, the college number, the survival floor. Two reasons it is higher. The error is asymmetric — underfunding a thirty-year retirement is not recoverable, while overfunding it is — and the basket this book’s reader actually buys is not the headline basket. Private tuition, healthcare, home services, insurance, and property tax have run persistently above CPI-U.
There is a third case worth naming because it is where the mistake is most expensive. Decisions about fixed-rate debt should use the lowest rate you can defend, which today means the traded breakeven. A high assumed inflation rate makes a fixed mortgage look like free money and argues against ever paying it down, and that argument is only as good as the inflation assumption underneath it (section “Using Debt Well: A Decision Framework”).
Better than any default is your own number. Compute a weighted rate across your own spending categories; the method is in section “Measuring and Forecasting Inflation”, along with which published index governs which of your obligations — because “inflation” is not one number, and the differences between CPI-U, CPI-W, chained CPI, and PCE decide your tax brackets, your Social Security raise, and your TIPS principal, respectively.
What matters for the rest of this chapter is only the arithmetic: whatever rate you choose, it compounds, and it compounds against you.
Inflation is not something you can wish away, and its absence is no gift either. The opposite of inflation — deflation, a sustained fall in prices — usually signals an economy contracting hard, as in 2008, and tends to arrive alongside bank failures and collapsing asset values. Plan for a persistent inflationary headwind of roughly 2.5% as the normal state of affairs, and treat the rare deflationary year as a warning siren, not a windfall.
Where inflation actually comes from — money supply and velocity, demand-pull versus cost-push, wage-price spirals — is treated with the rest of the inflation analytics in section “Causes of Inflation, and Which Kind Hurts You”. Carry one conclusion from it: which kind of inflation you are in decides whether your income keeps up, and the defense against the kind that outruns your income is structural — fixed-rate debt, productive assets, income that reprices — instead of tactical trading.